Archive ready
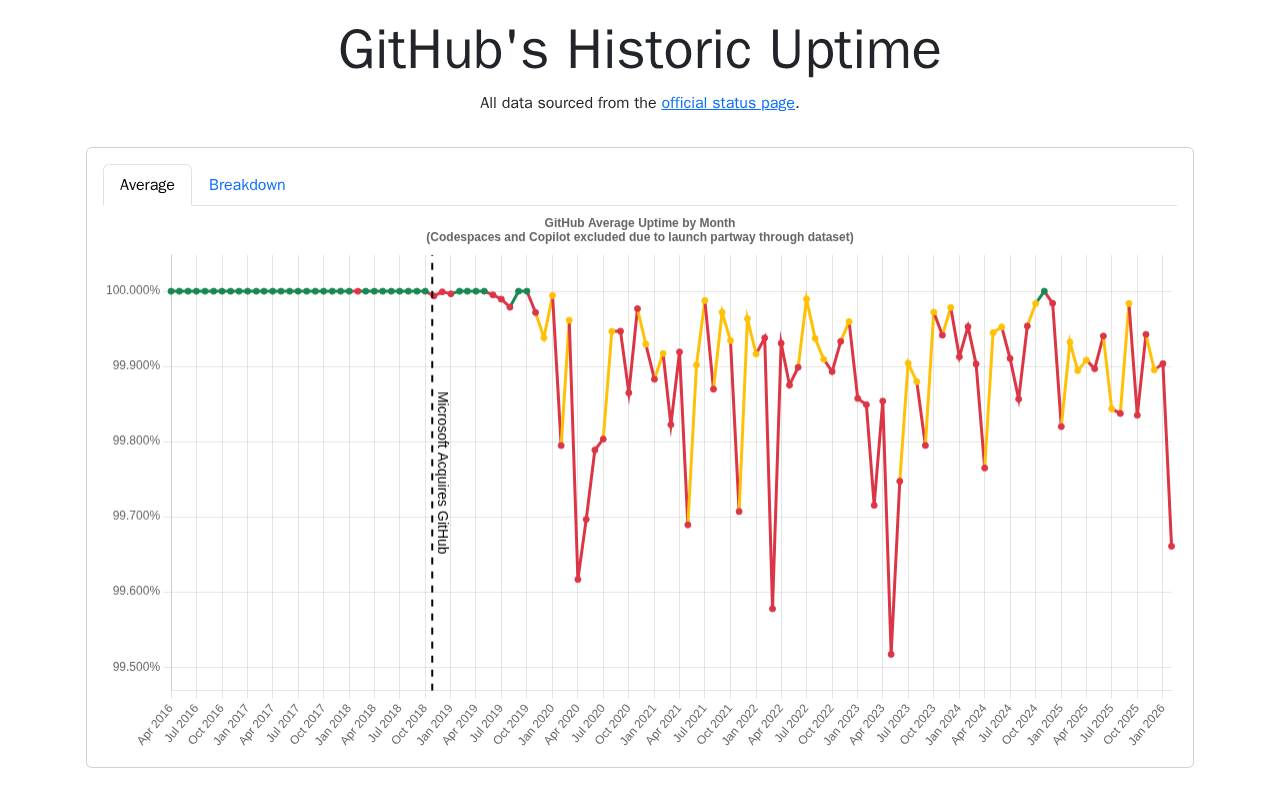
Historical GitHub Uptime Charts
https://damrnelson.github.io/github-historical-uptime/April 1, 2026 at 09:46 AM JST•The archive page, viewer, and downloads use this saved version.
April 1, 2026 at 09:46 AM JST·damrnelson.github.io
The evidence pack includes HTML, screenshots, summaries, and metadata. It can be downloaded on Pro.